Appendix
We provide additional information about the annotation interface we built to label PodcastFillers, the distribution of voice pitch in the dataset.
Annotation interface
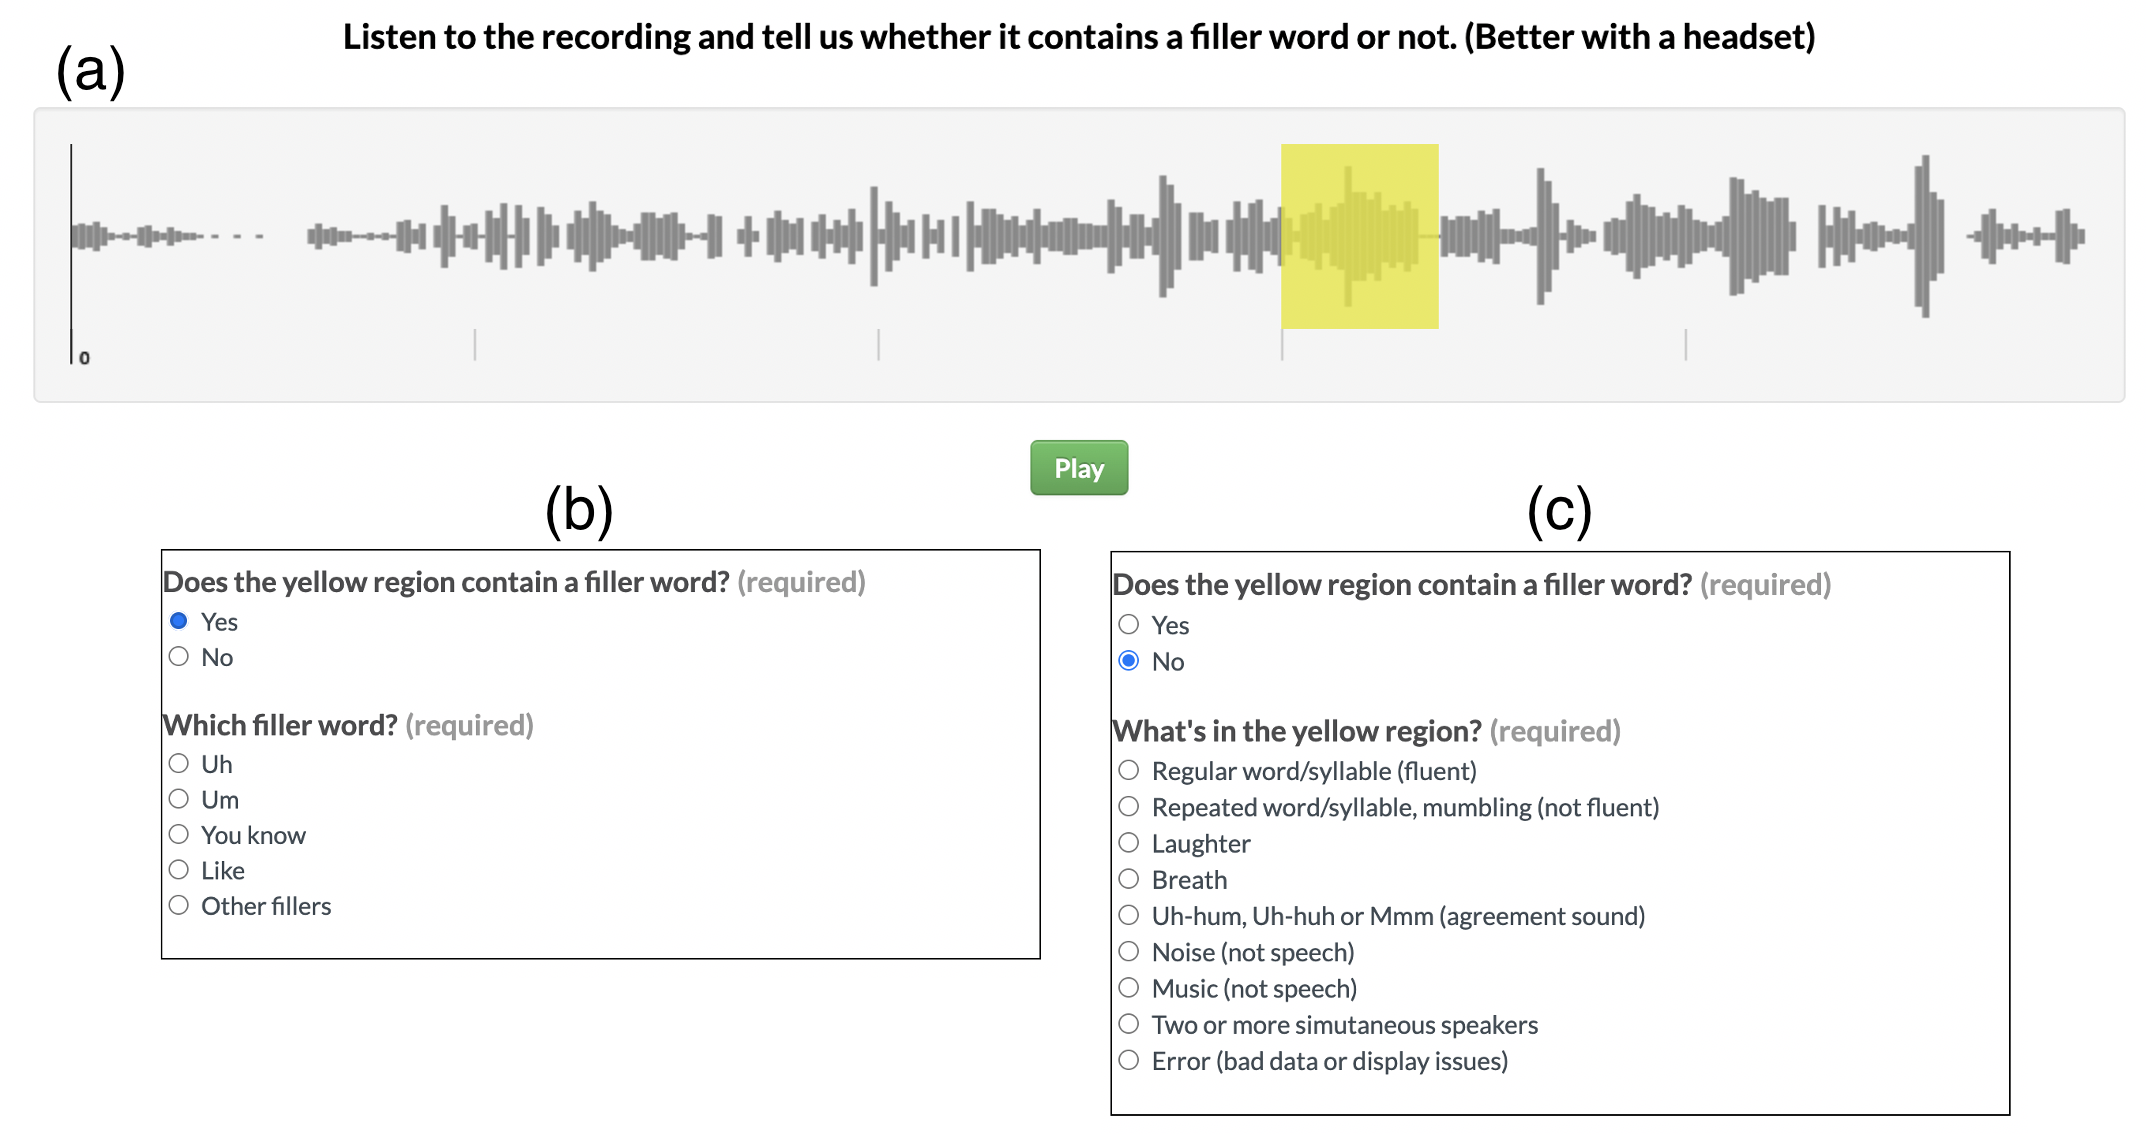
To annotate the PodcastFillers dataset, we custom-built the annotation interface depicted in the figure below. Annotators were presented with an audio player with a waveform visualization of a 5 s audio clip, with a filler word candidate at time 3 s highlighted in yellow (a). Annotators were first asked if the yellow region contains a filler word or not. Based on their answer, a second list of options appeared for them to label the fine-grained filler or non-filler type, depicted in (b) and (c) respectively.
Pitch distribution
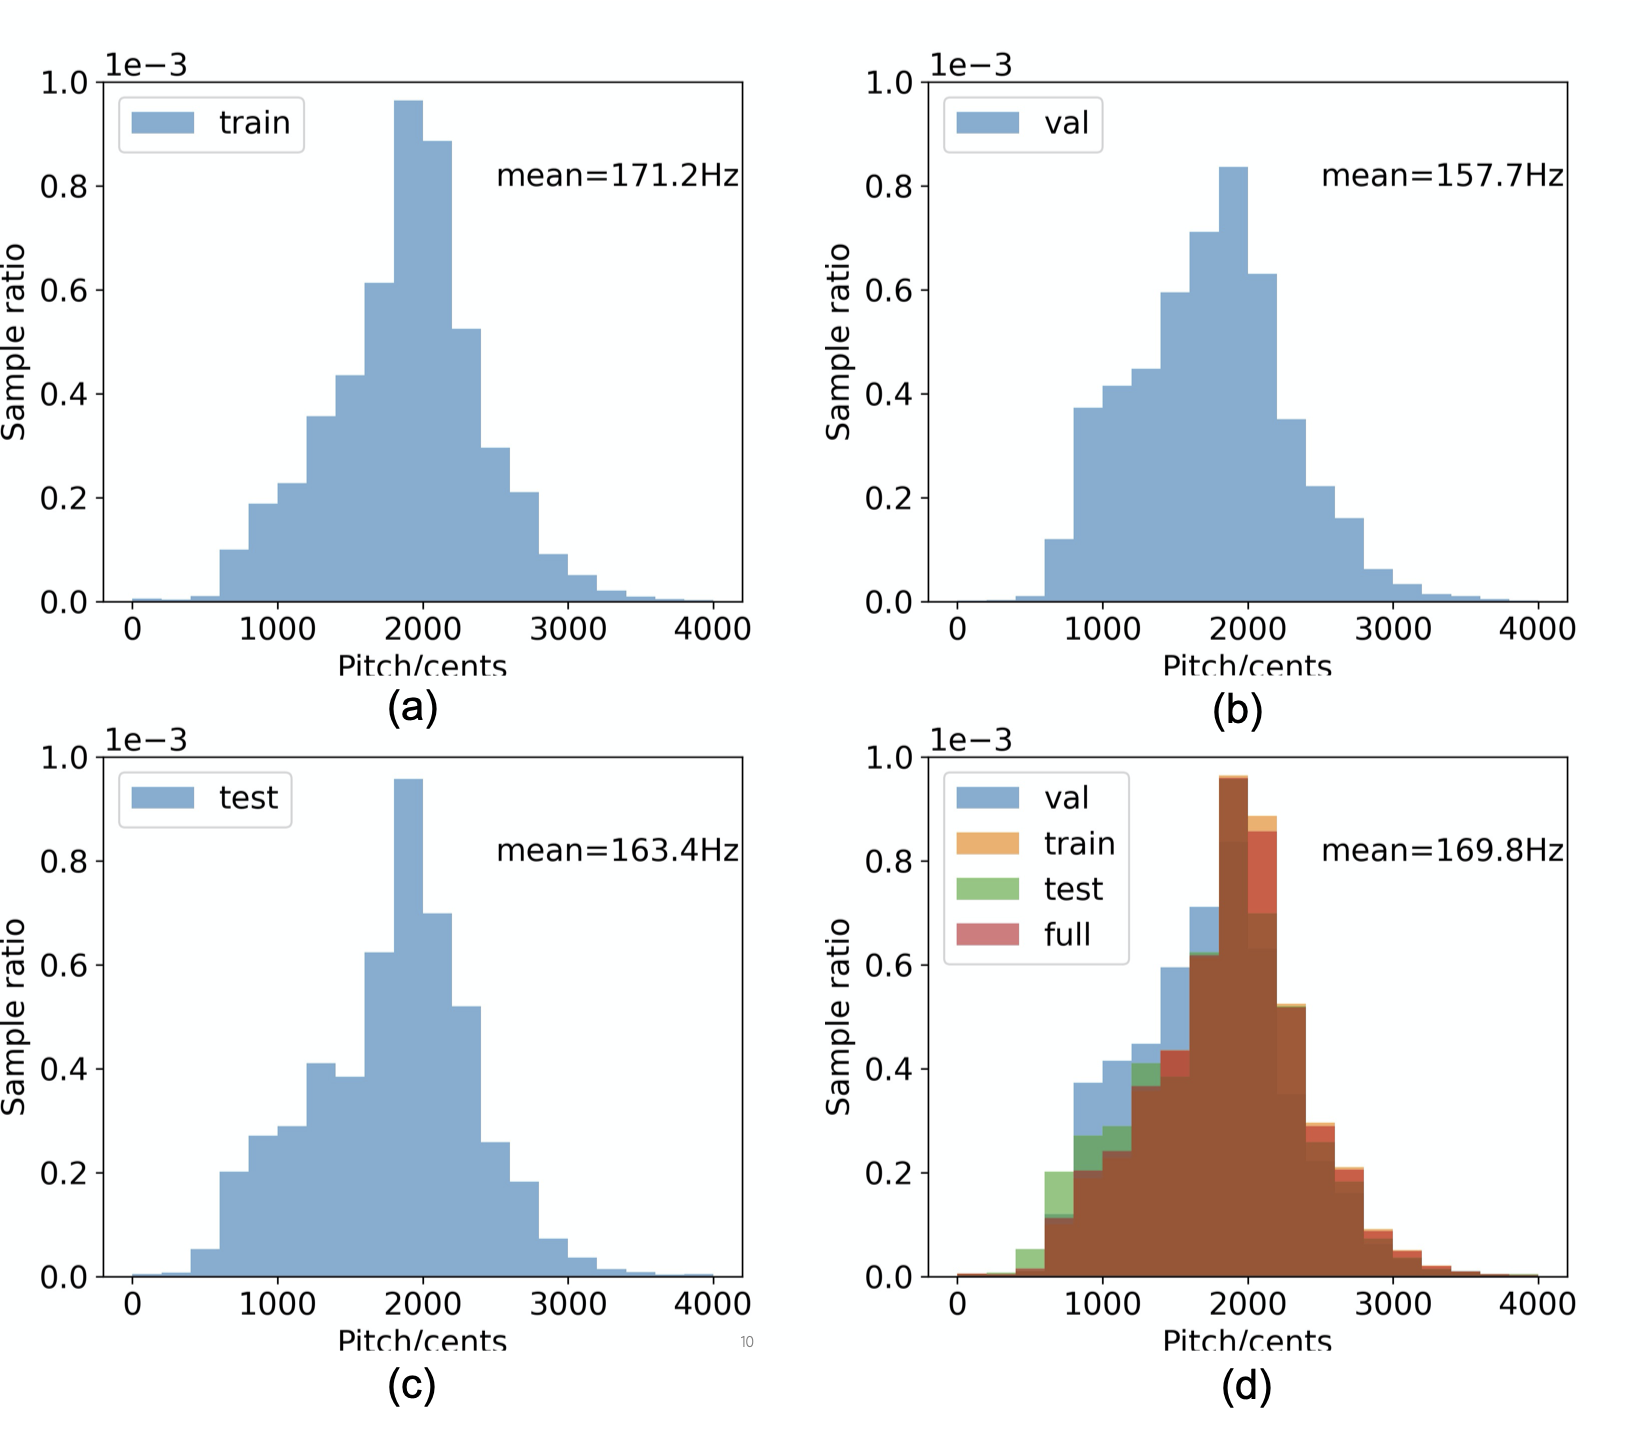
When curating PodcastFillers dataset, we ensured the pitch (f0) of the voices in the dataset spans the range of adult speech pitch from 60 Hz to 300 Hz. We used CREPE for pitch estimation, and measure pitch in cents relative to 55 Hz. The pitch distribution for all filler candidates in the dataset is depicted in (d), with a mode roughly at the center of the pitch range, around 170 Hz.
The dataset contains roughly equally decreasing numbers of samples as we move away from the mode toward higher and lower voices. The train, validation and test splits, depicted in subplots (a), (b), (c) respectively, exhibit a similar pitch distribution for filler candidates.